Do you have a business process that’s complicated? Do you have information that is a bit dry to digest? Infographics are a great way to illustrate data in a more engaging way.
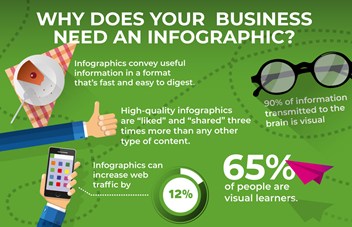
Infographics break information down into a more graphical representation which is often complimented with some text to make the subject more understandable and digestible for the reader. It is believed that the brain absorbs visual information more quickly than written and in an age where our attention span is so short, this is vastly important.
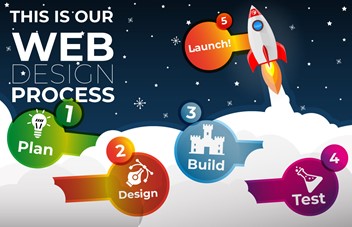
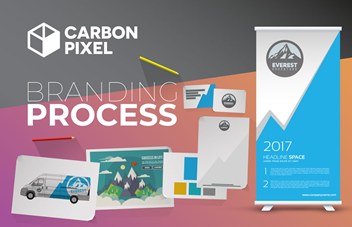
We’ve used infographics to illustrate our website development and brand processes for our clients - see the links below.
They are branded and simple, easy to understand and cut through the noise to get across the important points.
If you would like us to help you illustrate your data whether it be processes, maps, statistics or anything you need to simplify, just get in touch [email protected].
LINKS
Take a look at the infographic for our web development process.
Take a look at the infographic for our design process.
Take a look at the infographic for our brand process.
Take a look at the infographic for our digital marketing process.
Take a look at the infographic of some recent social media stats.